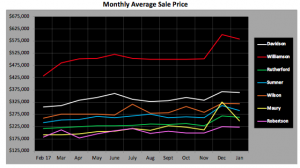
Jan 2018 avg sales prices for the month are still tracking higher than Jan of 2017 with Williamson increasing by 16.6%. However, compared to Dec 2017, all counties have decreased. The January Median Sales Price also has increased vs LY, with Maury at a 14.1% improvement.
Williamson County: As compared to January 2017
- Average sales price in Brentwood increased from $726,729 in 2017 to $1,038,067 in 2018, a 42.8% difference, but units sold per month stayed the exact same
- Overall, Williamson County’s average sales price increased 16.6% from Jan 2017 to Jan 2018
- Average days on the market in Williamson County increased from 55 days to 65 days
- Average sales price ratio is 98.2% in Williamson County, down 1.1% from last year
Davidson County: As compared to January 2017
- Average sales price for all of Davidson County increased 8.7% to $363,637
- Average sales price/sq ft increased 11.6% to $178.78
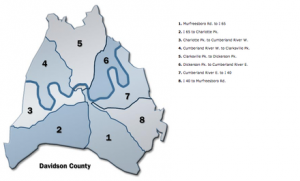
- Average sales price in Area 2 increased 20.7% to $727,462, but units sold per month decreased 18.7%.
- Area 4 days on the market increased from 46 to 92 this year